
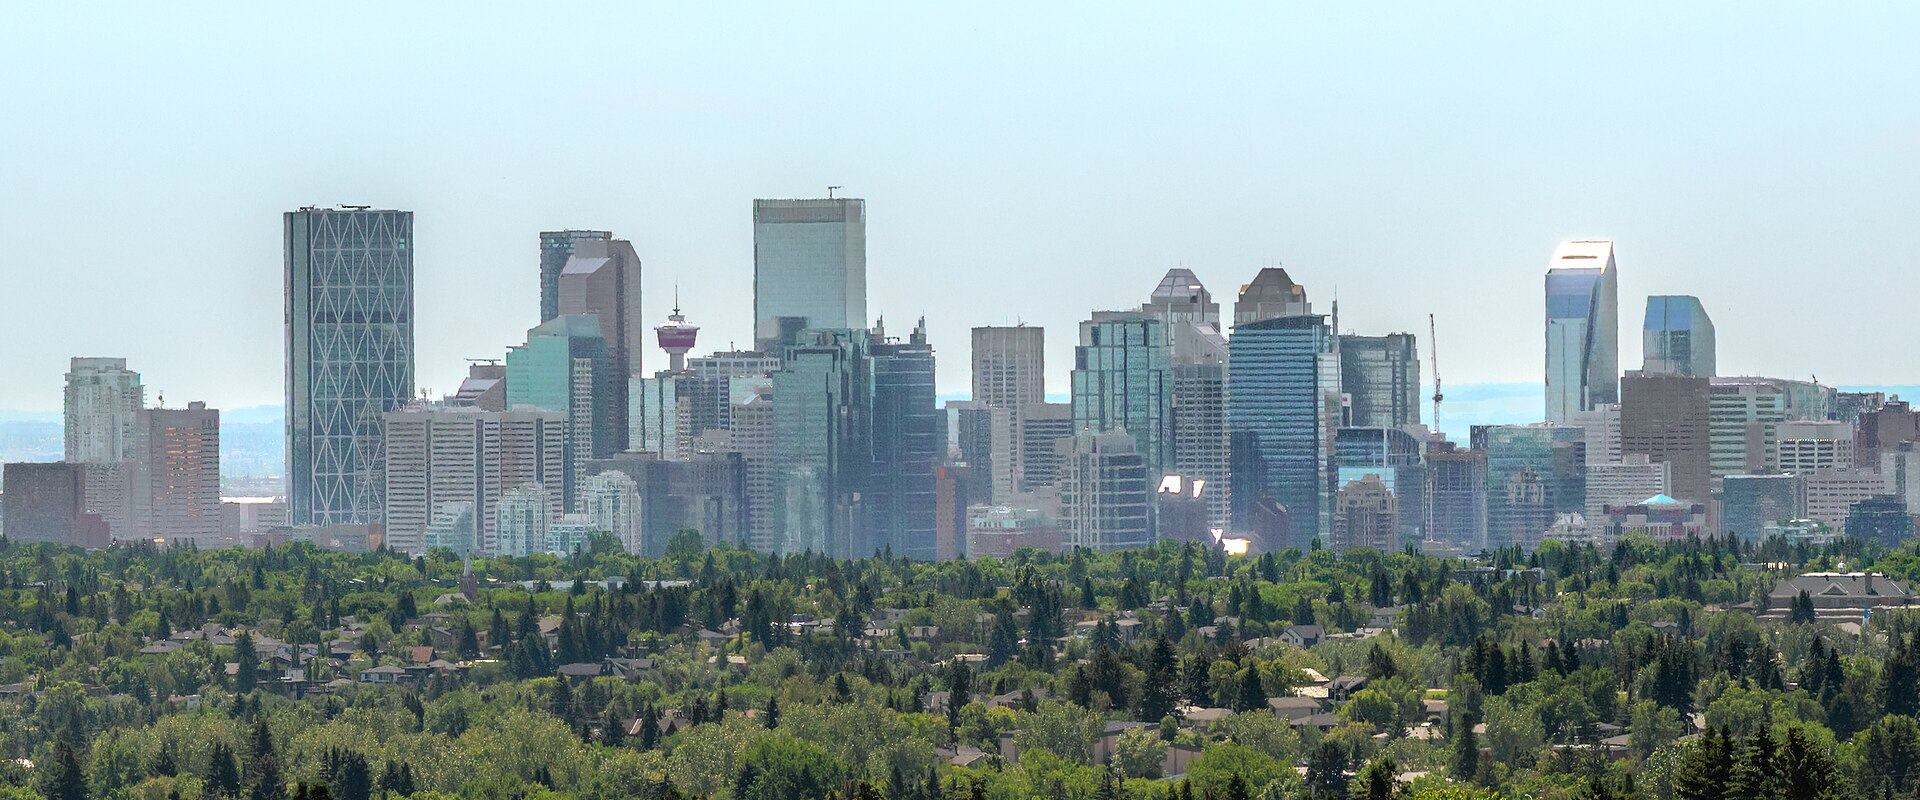
H1 2026Calgary cooled, and the production builders still own it.
The steepest decline in this series: permits down 14% and screened value down 26% against H1 2025. It is also the cleanest builder data of any new market Builtie tracks — Jayman, Brookfield Residential, Truman, Excel, Trico and Morrison are the actual homebuilders, not their subs, and together they carry the residential market.
Down through the winter, back in June.
Monthly volume fell through the first quarter — 1,118 permits in February against 1,557 a year earlier — then recovered to 2,392 in June, the strongest month in the eighteen-month series. Whether that is a turn or a catch-up is the question the second half answers.
Permits issued by month
3 signals inside the market
Ten permits carry 19% of the half's value
10 permits out of 9,603 account for $548.7M of $2.93B in screened declared value. The thousands of smaller permits are volume, not dollars.
$106.1M on one filing
Construction of two residential towers, 18/19 storeys tall, on a common podium and single level below-grade p… — #114 225 60 Av Sw. Issued April 7, 2026.
30% new construction, 65% existing buildings
2,910 new-building permits carry 70% of declared value. New builds are a minority of the filings and a majority of the money.
We would rather show you nothing than the wrong map.
3,779 Calgary permits carry coordinates and not one of them lands in Calgary. Our geocoder resolved these addresses against an Ontario context, so they plot in southern Ontario instead — a bug on our side, not a gap in the city's data. We check every coordinate against the bounding box of the city it claims to be in, which is why this section is empty rather than showing you a map of the wrong place.
Re-geocoding is queued. Every other number on this page reads from the permit record itself and is unaffected — the map is the only section that depends on coordinates.
Six builders, and they are actually builders.
Unlike every other market in this series, Calgary's applicant field names the homebuilder rather than the sub who pulled the permit. That makes this the one new market where the leaderboard reads the way the GTA report's does — a target list of firms running multiple concurrent projects, each with a decision maker in Builtie.
Top 10 applicants of record
| # | Applicant of record | Permits | Screened value |
|---|---|---|---|
| 1 | JAYMAN BUILT | 260 | $84M |
| 2 | BROOKFIELD RESIDENTIAL (ALBERTA) | 174 | $56M |
| 3 | TRUMAN HOMES 1995 | 172 | $137M |
| 4 | EXCEL HOMES LIMITED PARTNERSHIP | 159 | $47M |
| 5 | MORRISON HOMES (CALGARY) | 151 | $39M |
| 6 | TRICO HOMES | 151 | $59M |
| 7 | CEDARGLEN GROUP (THE) | 137 | $47M |
| 8 | SHANE HOMES | 132 | $37M |
| 9 | HOMES BY AVI CALGARY LP | 127 | $38M |
| 10 | GENESIS BUILDERS GROUP | 110 | $37M |
| 11 | HOPEWELL RESIDENTIAL MANAGEMENT | 103 | $38M |
| 12 | STERLING HOMES | 86 | $28M |
| 13 | ROHIT COMMUNITIES | 85 | $32M |
| 14 | UMBRELLA CONSTRUCTION BASEMENT BUILDERS | 84 | $3M |
| 15 | MATTAMY (NORTHPOINT) | 82 | $28M |
| 16 | BROWN BOYS BUILDING DEVELOPERS | 71 | $4M |
| 17 | MATTAMY (ABERDEEN HEIGHTS) | 68 | $23M |
| 18 | BROADVIEW HOMES | 62 | $13M |
| 19 | NUVISTA HOMES | 58 | $13M |
| 20 | MATTAMY (YORKVILLE) | 57 | $20M |
Two thirds renovation, a third new.
65% of classified permits touch a building that already stands; new construction is 30%. New builds carry 70% of the declared value.
Work category
- New construction2,910 30%$2.05B
- Renovation / alteration6,241 65%$877M
- Demolition452 5%
Permit type as the city files it
Permit type table
| Type | Permits | Value |
|---|---|---|
| Residential Improvement Project / Existing | 3,190 | $154M |
| Single Construction Permit / New | 2,410 | $766M |
| Residential Improvement Project / New | 1,665 | $86M |
| Commercial / Multi Family Project / Existing | 1,386 | $637M |
| Commercial / Multi Family Project / New | 500 | $1.29B |
| Demolition / Existing | 452 | n/a |
The ten largest jobs of the half.
Ranked by the construction cost stated on the permit, after the value screen described in the methodology. These are single permits, not whole developments — a tower can appear as several.
The ten largest permits of the half
| # | Work | Applicant | Stated cost |
|---|---|---|---|
| 1 | Construction of two residential towers, 18/19 storeys tall, on a common podium and single level below-grade parkade#114 225 60 AV SW | ZEIDLER ARCHITECTURE | $106.1M |
| 2 | Construction of a 36 storey residential building with commercial tenant space on the main floor301 11 AV SW | TRUMAN HOMES 1995 | $81.7M |
| 3 | Construction of an 11 storey building with two levels of underground parkade and 323 residential units#117 100 13 AV SE | — | $71.7M |
| 4 | New 4-storey cana-pbs systems building#2 & 2-storey hub building#300 4050 128 AV SE | CANA MANAGEMENT | $53.0M |
| 5 | Advanced medical & the academy of the aged31 CURRIE LN SW | STATESMAN GC | $50.4M |
| 6 | Downtown office to residential conversion#300 640 5 AV SW | KANAS | $46.1M |
| 7 | Bluestone tower residential#703 710 12 AV SW | NORR ARCHITECTS ENGINEERS PLANNERS | $40.4M |
| 8 | Construction of a 6 storey building with three firewalls, 312 residential units and 9 future cru units on the main floo…1488 17 AV SW | LEAR CONSTRUCTION MANAGEMENT | $37.9M |
| 9 | New 6 storey residential building & parkade3841 UNIVERSITY AV NW | TRUMAN HOMES 1995 | $34.3M |
| 10 | Office to residential conversion#200 510 5 ST SW | 2382197 ALBERTA | $27.0M |
The same half, in every market Builtie tracks.
Permit counts are directly comparable. Dollar figures are not fully comparable across borders and jurisdictions — each city defines "construction value" its own way, and the coverage column shows how many of its permits state one at all. A market is marked withheld where that share is too low to stand behind.
Permits issued, H1 2026
| Market | Permits | YoY | Screened value | Avg per costed permit | Cost coverage |
|---|---|---|---|---|---|
| New York | 53,624 | n/a | $17.14B | $376K | 85% |
| Miami | 20,481 | +0% | $9.88B | $495K | 97.4% |
| Toronto | 15,118 | +67% | $5.94B | $1.1M | 34.6% |
| Austin | 14,915 | -2% | withheld | n/a | 7% |
| Calgarythis report | 9,603 | -14% | $2.93B | $333K | 91.6% |
| Nashville | 4,287 | -1% | $1.69B | $394K | 100% |
| Chicago | 3,667 | -1% | $4.88B | $1.3M | 100% |
| Seattle | 3,011 | -1% | $1.80B | $604K | 99.1% |
| Hamilton | 2,337 | -7% | $897M | $405K | 94.7% |
| Vancouver | 2,036 | -9% | $3.11B | $1.6M | 98.2% |
What is behind every number above.
A report is only worth the disclosure attached to it. This is the whole of it.
How the figures are built
- Source
- Calgary's own published building-permit record, ingested into the Builtie platform and read live from it. No third-party estimate is mixed in.
- Period
- Permits issued between January 1, 2026 and June 30, 2026. Applications and cancellations are excluded.
- Declared value
- The construction cost stated by the applicant on the permit. It is not a contract value, and it excludes land and soft costs. 8,801 of 9,603 permits (91.6%) state one; the rest contribute to the count and not to the value.
- The value screen
- Two classes of bad value are removed before any total: any single permit at or above
$1,000,000,000, and any value at or above$10,000,000that repeats on five or more permits in the same city — a parent project total stamped onto its sub-permits, which would otherwise be counted once per sub-permit. No permit in this market tripped either rule. A percentile trim was tested and rejected: it cannot tell a corrupt value from a genuine large tower. - Rounding
- Values are rounded to the nearest million before display; shares are rounded to the nearest whole per cent, so columns may not sum to exactly 100.
What this page does not tell you
- No approval timeline
- This feed sets the application date equal to the issue date on every row, so we cannot say how long Calgary takes to approve a permit. The field is 100% populated, which is exactly why it is easy to mistake for real: it is a placeholder, and a "same-day approval" chart drawn from it would be a fabrication. The GTA report carries this section because Toronto publishes a genuine application date.
- No density map
- 3,779 permits carry coordinates and every one of them falls outside Calgary — our geocoder resolved the addresses against the wrong region. Coordinates are validated against each city's bounding box before anything is plotted, so the section is withheld rather than wrong. Re-geocoding is queued.