
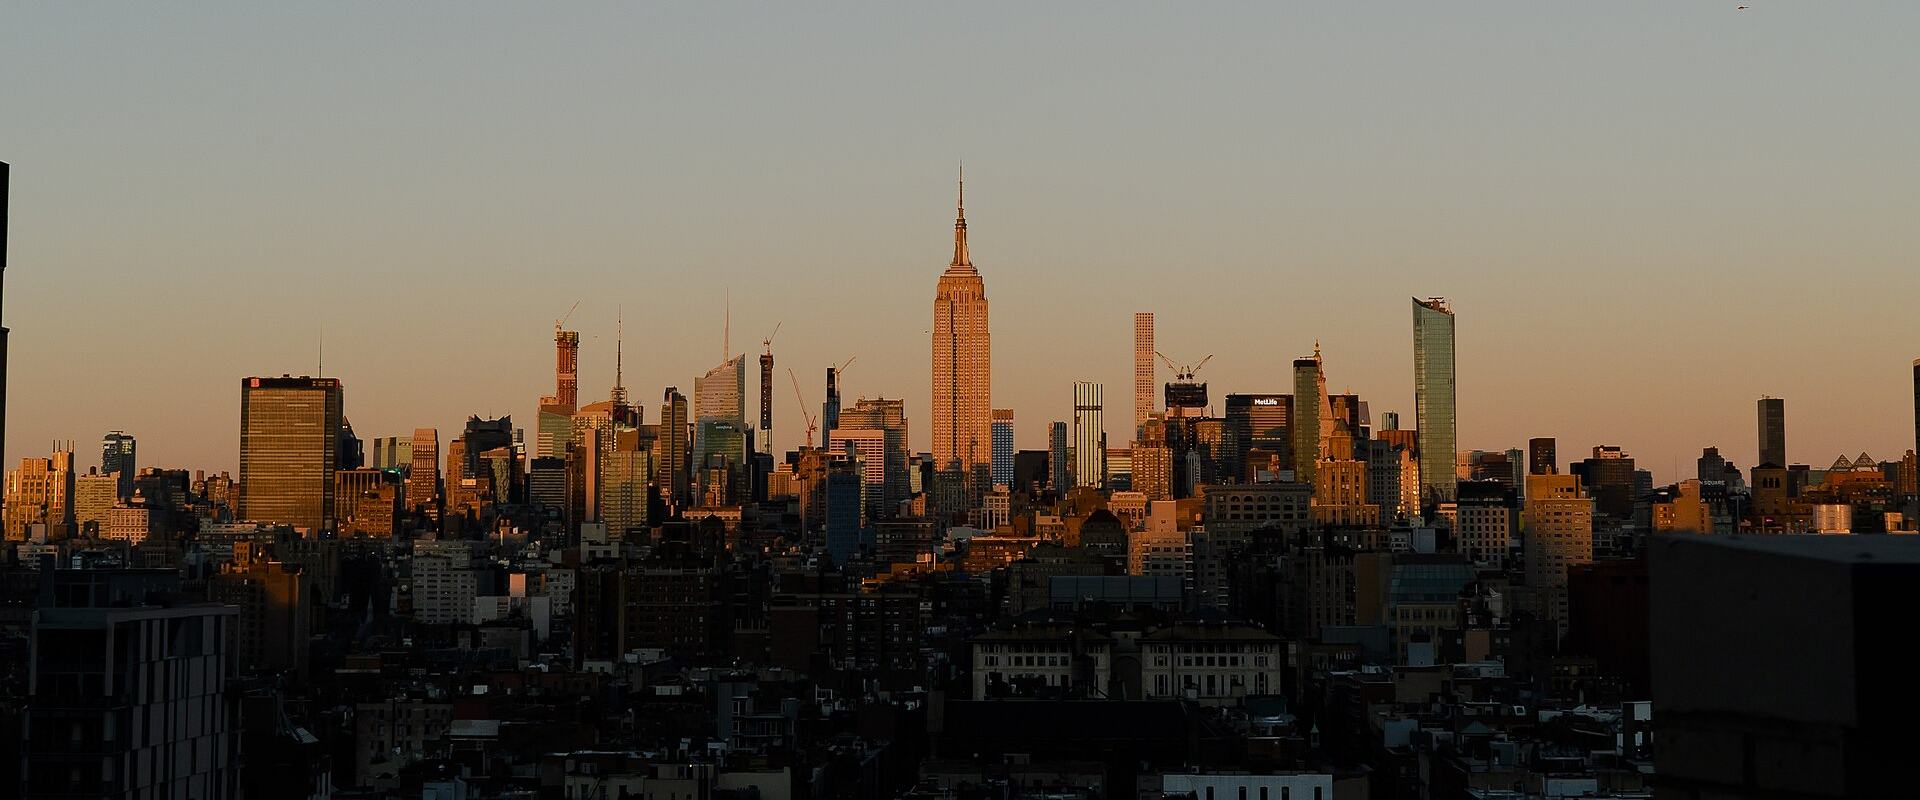
H1 2026New York renovates at industrial scale.
The largest permit volume Builtie tracks anywhere, and almost none of it is new construction. 86.8% of New York filings in the half are alterations. The new-building line is 6,161 permits — smaller than Austin's. If you sell into new construction here you are fishing in 11% of the market; if you sell into occupied buildings, this is the deepest pool on the continent.
A renovation market that never stops.
Volume runs 12,000 to 15,000 permits a month with no seasonal collapse — the work is indoors and the buildings are already standing. Note the ingest window: New York permits entered the platform on 27 February 2026, so January and most of February are absent and the half-year total is a four-month count.
Permits issued by month
3 signals inside the market
Ten permits carry 12% of the half's value
10 permits out of 53,624 account for $2.06B of $17.14B in screened declared value. The thousands of smaller permits are volume, not dollars.
$575.1M on one filing
Mpp#442/nyc dev hub filing: application filed for renovations to arthur ashe stadium and updated layouts to o… — 122-02 Roosevelt Avenue Queens. Issued June 8, 2026.
11% new construction, 87% existing buildings
6,161 new-building permits carry 12% of declared value. Value tracks volume here; the work is spread across many mid-sized jobs.
We would rather show you nothing than the wrong map.
14,164 New York permits carry coordinates and not one of them lands in New York. Our geocoder resolved these addresses against an Ontario context, so they plot in southern Ontario instead — a bug on our side, not a gap in the city's data. We check every coordinate against the bounding box of the city it claims to be in, which is why this section is empty rather than showing you a map of the wrong place.
Re-geocoding is queued. Every other number on this page reads from the permit record itself and is unaffected — the map is the only section that depends on coordinates.
The name on the permit is usually an engineer.
This is the single most important thing to understand about New York. The applicant of record is overwhelmingly the filing engineer, expediter or testing lab — Robert Derector Associates is an MEP engineering firm, McHenery is a testing lab, Rigid Structural Design is a structural consultancy. They are not the general contractor, and they are on the job months before one is hired. For a trade, that makes them the earliest reachable relationship in the chain rather than a bad match.
Top 10 applicants of record
| # | Applicant of record | Permits | Screened value |
|---|---|---|---|
| 1 | Always Fast Services Corp | 718 | $1M |
| 2 | ROBERT DERECTOR ASSOCIATES | 576 | $324M |
| 3 | MCHENERY TESTING LAB | 563 | $7M |
| 4 | RIGID STRUCTURAL DESIGN, LLC | 438 | $4M |
| 5 | VASILIOS ARTEMIOU PE | 436 | $9M |
| 6 | MOMENTUM SOLAR | 402 | $15M |
| 7 | PARKER AND WEST ENGINEERING, PLLC | 393 | $15M |
| 8 | TOM PETERSEN ARCHITECT, LLC | 386 | $20M |
| 9 | MG ENGINEERING D.P.C. | 383 | $77M |
| 10 | Farhad Bassiri-Tehrani | 367 | $30M |
| 11 | FL&M ENGINEERING DESIGN &INSPECTION | 355 | $6M |
| 12 | PAUL PERDEK, PROF. ENG. PLLC | 304 | $2M |
| 13 | Soni Engineering Consulting | 292 | $1M |
| 14 | COSENTINI ASSOCIATES | 272 | $155M |
| 15 | AMA CONSULTING ENGINEERS, PC | 268 | $79M |
| 16 | ASR ENGINEERING PC | 250 | $11M |
| 17 | NY BUILDING ASSOCIATES INC | 247 | $82M |
| 18 | BRIAN ILL DEVELOPMENT LLC | 238 | $12M |
| 19 | ELEVATED ENGINEERING NYC | 231 | n/a |
| 20 | LORING CONSULTING ENGINEERS, INC. | 219 | $139M |
Eleven per cent new, eighty-seven per cent existing.
87% of classified permits touch a building that already stands; new construction is 11%. New builds carry 12% of the declared value.
Work category
- New construction6,161 11%$2.03B
- Renovation / alteration46,552 87%$14.93B
- Demolition911 2%$171M
Permit type as the city files it
Permit type table
| Type | Permits | Value |
|---|---|---|
| Alteration | 41,724 | $10.97B |
| New Building | 6,161 | $2.03B |
| Alteration CO | 4,828 | $3.96B |
| Full Demolition | 911 | $171M |
The ten largest jobs of the half.
Ranked by the construction cost stated on the permit, after the value screen described in the methodology. These are single permits, not whole developments — a tower can appear as several.
The ten largest permits of the half
| # | Work | Applicant | Stated cost |
|---|---|---|---|
| 1 | Mpp#442/nyc dev hub filing: application filed for renovations to arthur ashe stadium and updated layouts to obtain new…122-02 ROOSEVELT AVENUE Queens | MATTHEW L ROSSETTI ARCHITECT PC | $575.1M |
| 2 | Hereby filing for a new mixed-use building developed as two towers on a 5 story base.495 11 AVENUE Manhattan | GENE KAUFMAN ARCHITECT, PC | $397.3M |
| 3 | Alterations of altschul consisting of renovations and additions as per plans and supporting documentation filed herein…46 CLAREMONT AVENUE Manhattan | PERKINS&WILL ARCHITECTS, PC | $181.5M |
| 4 | Conversion of existing commercial building to residential under article 1, chapter 5. work to include repositioning of…111 WALL STREET Manhattan | GENSLER | $154.5M |
| 5 | Nyu - loh - bulk oxygen as per plans. no change in use, egress or occupancy.301 EAST 17 STREET Manhattan | Facility Leaders in Architectural/E | $136.0M |
| 6 | Nyu - loh - mechanical modifications for bulk oxygen . no change in use, egress or occupancy.301 EAST 17 STREET Manhattan | R.G. VANDERWEIL ENGINEERS, PC | $136.0M |
| 7 | Construct new thirty-three (33) story mixed-use building as per plans filed.71 PRINCE STREET Brooklyn | AUFGANG ARCHITECTS | $132.0M |
| 8 | As per hub consultation. the expansion project will be designed & classified as an addition to the existing rbsp & will…1150 ST NICHOLAS AVENUE Manhattan | KOHN PEDERSEN FOX | $130.0M |
| 9 | Interior work includes the installation of acoustical window inserts at courtyard-facing rooms. no change to occupancy…325 PARK AVENUE Manhattan | ACHESON DOYLE PARTNERS ARCHITECTS | $115.0M |
| 10 | Construct new thirteen (13) story building as per plans filed.77 KOSCIUSZKO STREET Brooklyn | S. WIEDER ARCHITECT P.C. | $100.0M |
The same half, in every market Builtie tracks.
Permit counts are directly comparable. Dollar figures are not fully comparable across borders and jurisdictions — each city defines "construction value" its own way, and the coverage column shows how many of its permits state one at all. A market is marked withheld where that share is too low to stand behind.
Permits issued, H1 2026
| Market | Permits | YoY | Screened value | Avg per costed permit | Cost coverage |
|---|---|---|---|---|---|
| New Yorkthis report | 53,624 | n/a | $17.14B | $376K | 85% |
| Miami | 20,481 | +0% | $9.88B | $495K | 97.4% |
| Toronto | 15,118 | +67% | $5.94B | $1.1M | 34.6% |
| Austin | 14,915 | -2% | withheld | n/a | 7% |
| Calgary | 9,603 | -14% | $2.93B | $333K | 91.6% |
| Nashville | 4,287 | -1% | $1.69B | $394K | 100% |
| Chicago | 3,667 | -1% | $4.88B | $1.3M | 100% |
| Seattle | 3,011 | -1% | $1.80B | $604K | 99.1% |
| Hamilton | 2,337 | -7% | $897M | $405K | 94.7% |
| Vancouver | 2,036 | -9% | $3.11B | $1.6M | 98.2% |
What is behind every number above.
A report is only worth the disclosure attached to it. This is the whole of it.
How the figures are built
- Source
- New York's own published building-permit record, ingested into the Builtie platform and read live from it. No third-party estimate is mixed in.
- Period
- Permits issued between February 27, 2026 and June 30, 2026. Applications and cancellations are excluded.
- Declared value
- The construction cost stated by the applicant on the permit. It is not a contract value, and it excludes land and soft costs. 45,565 of 53,624 permits (85%) state one; the rest contribute to the count and not to the value.
- The value screen
- Two classes of bad value are removed before any total: any single permit at or above
$1,000,000,000, and any value at or above$10,000,000that repeats on five or more permits in the same city — a parent project total stamped onto its sub-permits, which would otherwise be counted once per sub-permit. 33 New York permits were screened out this half. A percentile trim was tested and rejected: it cannot tell a corrupt value from a genuine large tower. - Rounding
- Values are rounded to the nearest million before display; shares are rounded to the nearest whole per cent, so columns may not sum to exactly 100.
What this page does not tell you
- No approval timeline
- This feed sets the application date equal to the issue date on every row, so we cannot say how long New York takes to approve a permit. The field is 100% populated, which is exactly why it is easy to mistake for real: it is a placeholder, and a "same-day approval" chart drawn from it would be a fabrication. The GTA report carries this section because Toronto publishes a genuine application date.
- No density map
- 14,164 permits carry coordinates and every one of them falls outside New York — our geocoder resolved the addresses against the wrong region. Coordinates are validated against each city's bounding box before anything is plotted, so the section is withheld rather than wrong. Re-geocoding is queued.
- Partial half
- New York permits entered the platform on February 27, 2026. The counts on this page are everything issued from that date to June 30 — a real count of a shorter window, not a full six months, and not comparable to a full-half figure from another market.
- No year-over-year
- There is no H1 2025 baseline for this market in the platform, so no growth figure is quoted anywhere on this page.