
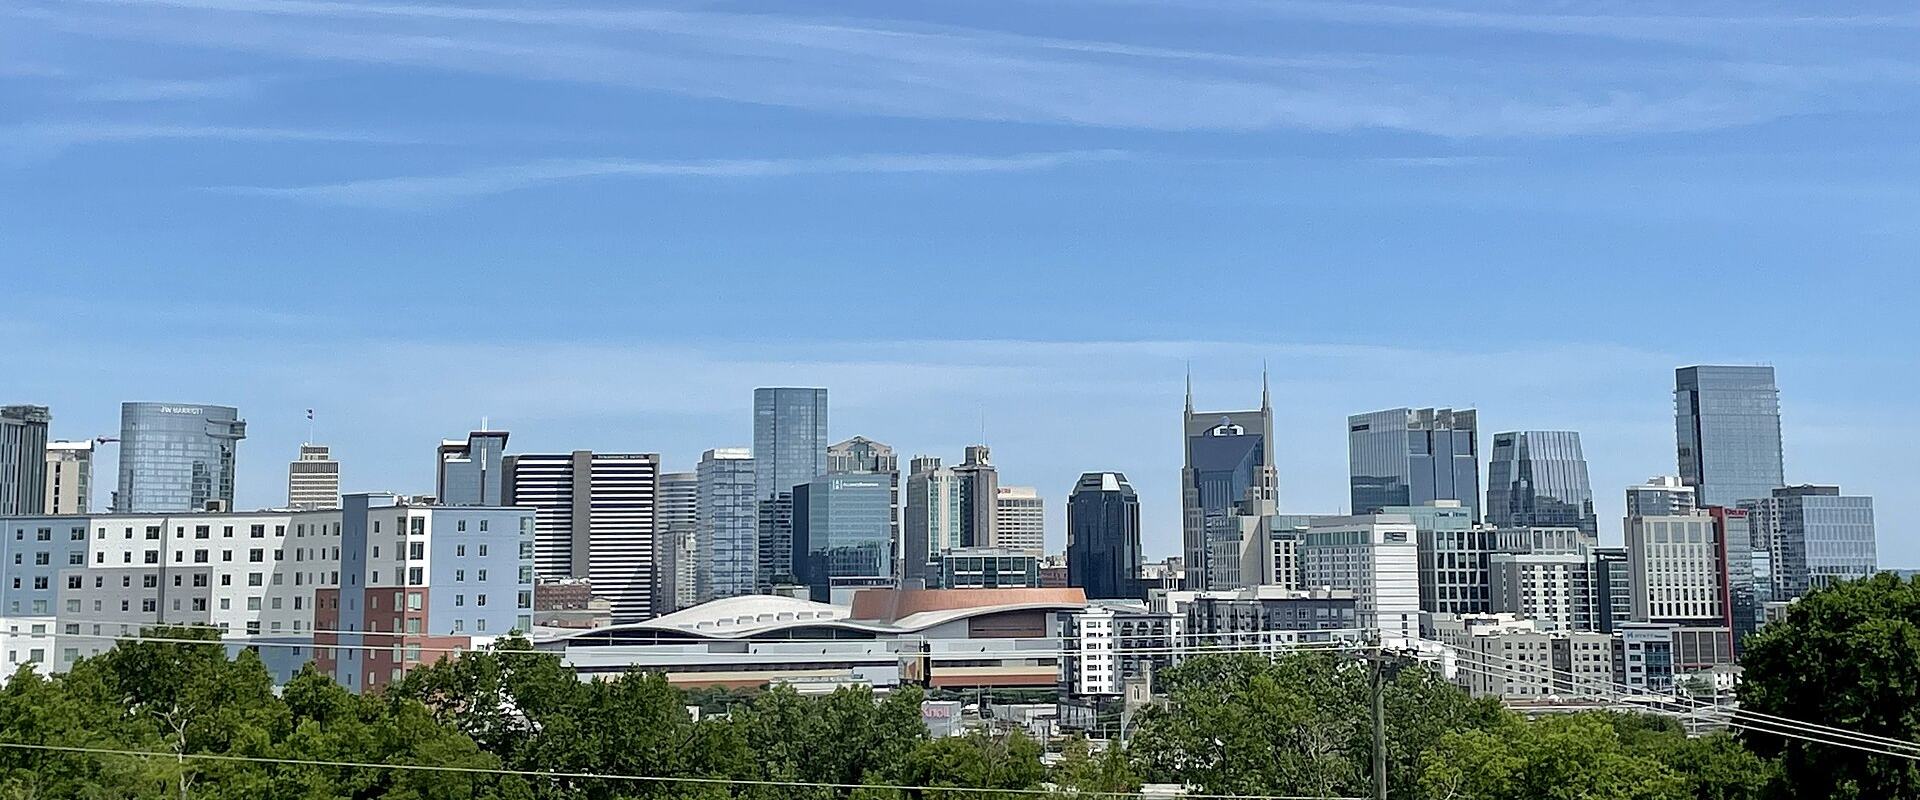
H1 2026Nashville is flat, and building new.
Permits within 1% of last year and screened value down 6% to $1.69B — the most stable market in this series. Underneath that flatness, 43.9% of permits are new construction and 9.2% are demolitions, the second-highest teardown rate here. Nashville is not growing its permit count; it is replacing its building stock.
Two years of the same shape.
Between 500 and 900 permits a month, every month, in both years. Nashville also states a construction cost on 100% of its permits — the best value coverage of any market in this series, which makes its dollar line the most trustworthy one here.
Permits issued by month
3 signals inside the market
Ten permits carry 18% of the half's value
10 permits out of 4,287 account for $309.0M of $1.69B in screened declared value. The thousands of smaller permits are volume, not dollars.
$53.0M on one filing
To conduct interior renovations to 30,000sf of building for seating, restrooms, food and beverage, etc. no ch… — 1 Terminal Dr. Issued June 4, 2026.
44% new construction, 47% existing buildings
1,880 new-building permits carry 51% of declared value. Value tracks volume here; the work is spread across many mid-sized jobs.
We would rather show you nothing than the wrong map.
2,242 Nashville permits carry coordinates and not one of them lands in Nashville. Our geocoder resolved these addresses against an Ontario context, so they plot in southern Ontario instead — a bug on our side, not a gap in the city's data. We check every coordinate against the bounding box of the city it claims to be in, which is why this section is empty rather than showing you a map of the wrong place.
Re-geocoding is queued. Every other number on this page reads from the permit record itself and is unaffected — the map is the only section that depends on coordinates.
A mixed table, and 233 owner-pulled jobs.
BRPH and Ryan Homes anchor the firm side; Legacy South and Regent Homes are the local residential volume. The 233 permits filed as self-contractor are homeowners acting as their own GC — small jobs, but jobs with no contractor of record yet.
Top 10 applicants of record
| # | Applicant of record | Permits | Screened value |
|---|---|---|---|
| 1 | BRPH | 186 | $13M |
| 2 | Municipal Inspection Partners | 105 | $64M |
| 3 | NVR, INC. T/A RYAN HOMES | 88 | $33M |
| 4 | LEGACY SOUTH BUILDERS LLC | 85 | $26M |
| 5 | REGENT HOMES | 56 | $14M |
| 6 | amanda tupper | 55 | $47M |
| 7 | MERITAGE HOMES OF TENNESSEE INC | 55 | $21M |
| 8 | ben azzi | 36 | $8M |
| 9 | BEAZER HOMES LLC | 34 | $13M |
| 10 | Tuff Shed | 32 | n/a |
| 11 | WILSON & SONS LAND MANAGEMENT LLC | 27 | n/a |
| 12 | HUFFINE FIRST SERVICE | 26 | $5M |
| 13 | KCG HOMES LLC | 25 | $5M |
| 14 | ORANGE GROVE HOME BUILDERS, LLC | 25 | $3M |
| 15 | DREES PREMIER HOMES INC | 24 | $11M |
| 16 | Lennar Homes | 23 | $13M |
| 17 | atsushi makino | 22 | $8M |
| 18 | DURANTE COMPANIES INC | 22 | n/a |
| 19 | elizabeth hoots | 22 | $5M |
| 20 | COBALT VENTURES LLC | 21 | $9M |
Forty-four per cent new build.
44% of classified permits are for new construction — the highest ratio of new to existing on this list. New builds carry 51% of the declared value.
Work category
- New construction1,880 44%$868M
- Renovation / alteration2,014 47%$805M
- Demolition393 9%$15M
Permit type as the city files it
Permit type table
| Type | Permits | Value |
|---|---|---|
| Building Residential - New | 1,741 | $596M |
| Building Commercial - Rehab | 870 | $448M |
| Building Residential - Addition | 516 | $61M |
| Building Residential - Rehab | 441 | $41M |
| Building Demolition Permit | 393 | $15M |
| Building Commercial - Tenant Finish Out | 153 | $215M |
| Building Commercial - New | 139 | $272M |
| Building Commercial - Addition | 34 | $40M |
The ten largest jobs of the half.
Ranked by the construction cost stated on the permit, after the value screen described in the methodology. These are single permits, not whole developments — a tower can appear as several.
The ten largest permits of the half
| # | Work | Applicant | Stated cost |
|---|---|---|---|
| 1 | To conduct interior renovations to 30,000sf of building for seating, restrooms, food and beverage, etc. no change to fo…1 TERMINAL DR | adam merritt | $53.0M |
| 2 | To construct podium level of parking garage for belle meade plaza. not to be over any easements.4500 HARDING PIKE | beatrice pieri | $36.8M |
| 3 | To construct a new sub surface parking garage for cheekwood.1200 D FORREST PARK DR | HASTINGS ARCHITECTURE | $33.5M |
| 4 | To conduct rehab to 38,996sf of existing building for data processing hall and support infrastructure. no change to foo…420 WOODFOLK AVE | gertrude pieri | $30.5M |
| 5 | To construct 5-story residential dormitory, approximately 137,000 gsf for vanderbilt university student housing. swgr #…2401 VANDERBILT PL | Robert A.M. Stern Architects | $30.2M |
| 6 | This is phase 2 of the central core renovation project consisting of the construction of the new elevator tower and esc…1 TERMINAL DR | david dewees | $30.0M |
| 7 | To construct 4-story residential dormitory, approximately 143,000 gsf for vanderbilt university student housing. swgr #…2415 VANDERBILT PL | Robert A.M. Stern Architects | $27.9M |
| 8 | Finish out 158 dwelling units in three phases separated by fire barriers. not to be over any easements. need to speak t…92 WHITE BRIDGE PIKE | lindsey minkoff | $25.9M |
| 9 | To construct parking garage with pool and amenity space on top level. not to be over any easements. pool to be permitte…92 WHITE BRIDGE PIKE | lindsey minkoff | $21.6M |
| 10 | Full renovation existing south half, 4th floor vanderbilt university hospital (vuh): new walls, doors, ceilings, floori…1211 MEDICAL CENTER DR | BMD Architecture | $19.7M |
The same half, in every market Builtie tracks.
Permit counts are directly comparable. Dollar figures are not fully comparable across borders and jurisdictions — each city defines "construction value" its own way, and the coverage column shows how many of its permits state one at all. A market is marked withheld where that share is too low to stand behind.
Permits issued, H1 2026
| Market | Permits | YoY | Screened value | Avg per costed permit | Cost coverage |
|---|---|---|---|---|---|
| New York | 53,624 | n/a | $17.14B | $376K | 85% |
| Miami | 20,481 | +0% | $9.88B | $495K | 97.4% |
| Toronto | 15,118 | +67% | $5.94B | $1.1M | 34.6% |
| Austin | 14,915 | -2% | withheld | n/a | 7% |
| Calgary | 9,603 | -14% | $2.93B | $333K | 91.6% |
| Nashvillethis report | 4,287 | -1% | $1.69B | $394K | 100% |
| Chicago | 3,667 | -1% | $4.88B | $1.3M | 100% |
| Seattle | 3,011 | -1% | $1.80B | $604K | 99.1% |
| Hamilton | 2,337 | -7% | $897M | $405K | 94.7% |
| Vancouver | 2,036 | -9% | $3.11B | $1.6M | 98.2% |
What is behind every number above.
A report is only worth the disclosure attached to it. This is the whole of it.
How the figures are built
- Source
- Nashville's own published building-permit record, ingested into the Builtie platform and read live from it. No third-party estimate is mixed in.
- Period
- Permits issued between January 1, 2026 and June 30, 2026. Applications and cancellations are excluded.
- Declared value
- The construction cost stated by the applicant on the permit. It is not a contract value, and it excludes land and soft costs. Every permit in this market states one.
- The value screen
- Two classes of bad value are removed before any total: any single permit at or above
$1,000,000,000, and any value at or above$10,000,000that repeats on five or more permits in the same city — a parent project total stamped onto its sub-permits, which would otherwise be counted once per sub-permit. No permit in this market tripped either rule. A percentile trim was tested and rejected: it cannot tell a corrupt value from a genuine large tower. - Rounding
- Values are rounded to the nearest million before display; shares are rounded to the nearest whole per cent, so columns may not sum to exactly 100.
What this page does not tell you
- No approval timeline
- This feed sets the application date equal to the issue date on every row, so we cannot say how long Nashville takes to approve a permit. The field is 100% populated, which is exactly why it is easy to mistake for real: it is a placeholder, and a "same-day approval" chart drawn from it would be a fabrication. The GTA report carries this section because Toronto publishes a genuine application date.
- No density map
- 2,242 permits carry coordinates and every one of them falls outside Nashville — our geocoder resolved the addresses against the wrong region. Coordinates are validated against each city's bounding box before anything is plotted, so the section is withheld rather than wrong. Re-geocoding is queued.