
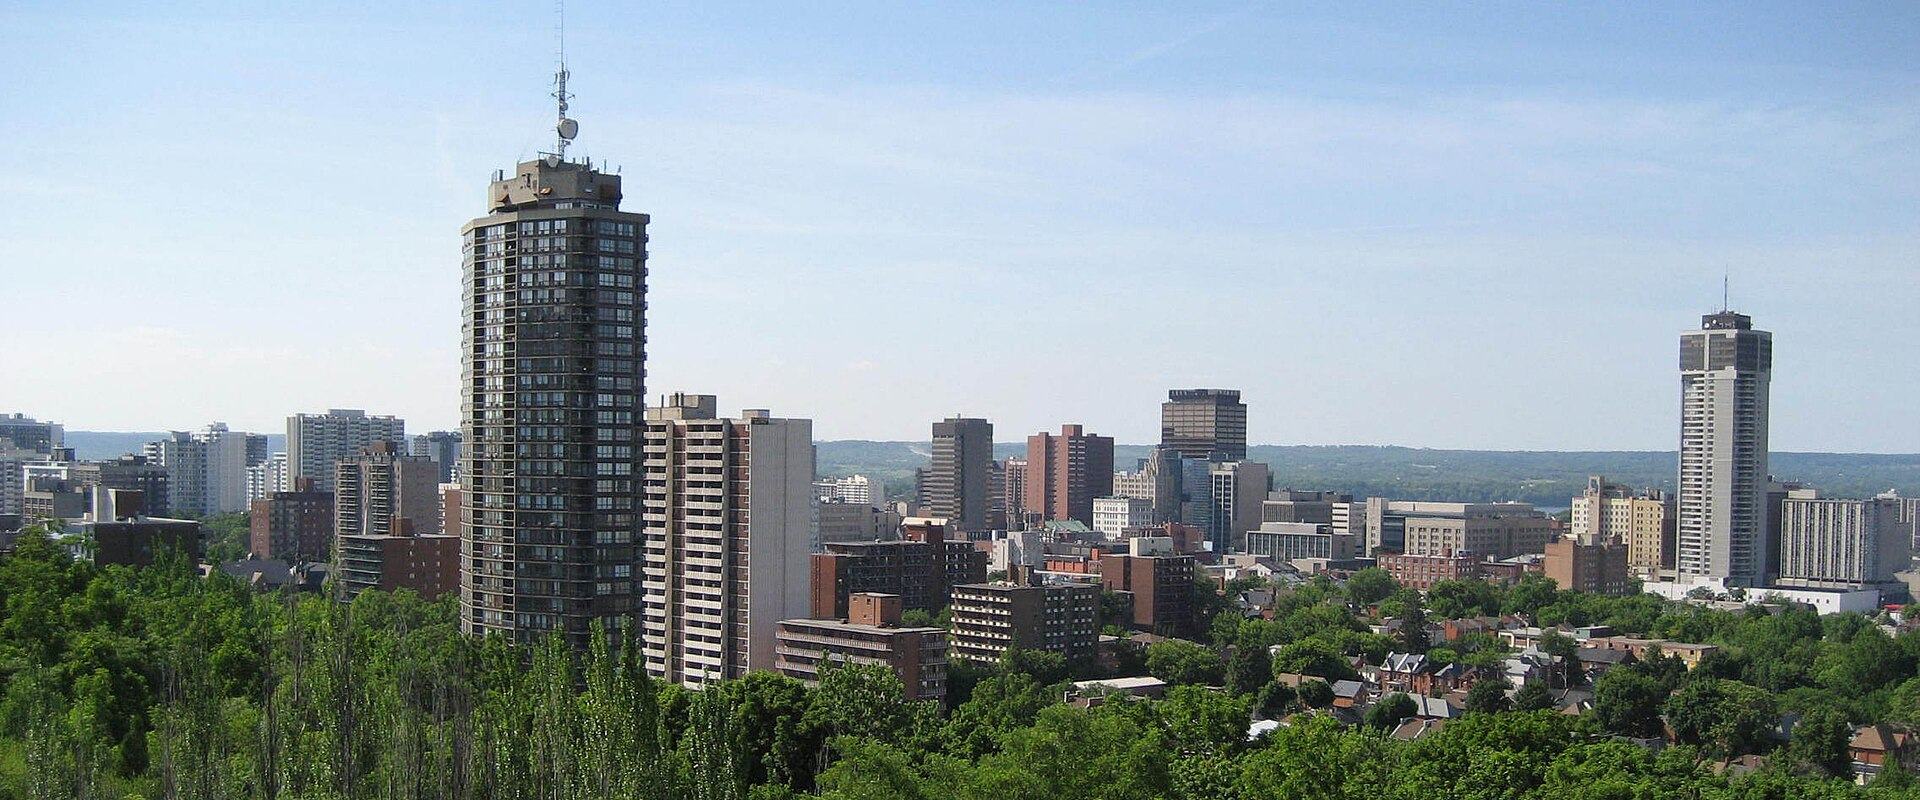
H1 2026Every permit, on the map.
Hamilton is the smallest market in this series and the only one where 100% of permits carry coordinates — 2,337 jobs, every one of them placeable. It is also a small-job market: the median permit states $20,000, the lowest here by a factor of two. Volume is down 7% and screened value down 35% to $897M.
A quieter half than last year.
Hamilton reports at monthly granularity rather than by issue date, so this series is monthly totals rather than a daily roll-up. Both count and value ran below 2025 for most of the half.
Permits issued by month
3 signals inside the market
Ten permits carry 50% of the half's value
10 permits out of 2,337 account for $450.0M of $897M in screened declared value. The thousands of smaller permits are volume, not dollars.
$214.7M on one filing
New construction — 60 Glover Road. Issued June 1, 2026.
20% new construction, 73% existing buildings
465 new-building permits carry 75% of declared value. New builds are a minority of the filings and a majority of the money.
The most completely mapped market Builtie holds.
Every one of the half's 2,337 permits has coordinates, shown here at roughly one-kilometre resolution. Nothing is missing from this map.
This feed does not name who is doing the work.
This feed does not carry an applicant or contractor name at all.
Builtie resolves the firms behind a project from company and decision-maker records rather than from the permit form alone, so this gap constrains this page — not the platform. Ask for live sample projects in this market and you will see named companies against them.
Three quarters renovation.
73% of classified permits touch a building that already stands; new construction is 20%. New builds carry 75% of the declared value.
Work category
- New construction465 20%$670M
- Renovation / alteration1,714 73%$224M
- Demolition158 7%$3M
Permit type as the city files it
Permit type table
| Type | Permits | Value |
|---|---|---|
| Single Family Dwelling | 1,040 | $110M |
| Single House, Single Detached Home, Bungalow, Linked | 205 | $56M |
| Apartment, Apartment Building, Duplex, Triplex, Quadruple | 93 | $76M |
| Wall Sign | 83 | $1M |
| Single Detached Dwelling with Internal Additional Dwelling | 71 | $6M |
| Class 4 - Leaching Bed System | 57 | $3M |
| Single Detached Dwelling with internal ADU | 42 | $4M |
| Retail Complex (Plaza, Mall, Shopping Center) | 40 | $21M |
The ten largest jobs of the half.
Ranked by the construction cost stated on the permit, after the value screen described in the methodology. These are single permits, not whole developments — a tower can appear as several.
The ten largest permits of the half
| # | Work | Applicant | Stated cost |
|---|---|---|---|
| 1 | New construction60 Glover Road | — | $214.7M |
| 2 | New construction374 Skinner Road | — | $39.2M |
| 3 | New construction525 Stone Church Road East | — | $35.0M |
| 4 | New construction188 Cannon Street East | — | $33.0M |
| 5 | New construction315 James Street North | — | $28.0M |
| 6 | New construction80 Alway Road | — | $27.0M |
| 7 | Alteration237 Barton Street East | — | $22.6M |
| 8 | Foundation374 Skinner Road | — | $22.0M |
| 9 | Alteration999 Upper Wentworth Street | — | $14.5M |
| 10 | Addition (nr)1390 Burlington Street East | — | $14.0M |
The same half, in every market Builtie tracks.
Permit counts are directly comparable. Dollar figures are not fully comparable across borders and jurisdictions — each city defines "construction value" its own way, and the coverage column shows how many of its permits state one at all. A market is marked withheld where that share is too low to stand behind.
Permits issued, H1 2026
| Market | Permits | YoY | Screened value | Avg per costed permit | Cost coverage |
|---|---|---|---|---|---|
| New York | 53,624 | n/a | $17.14B | $376K | 85% |
| Miami | 20,481 | +0% | $9.88B | $495K | 97.4% |
| Toronto | 15,118 | +67% | $5.94B | $1.1M | 34.6% |
| Austin | 14,915 | -2% | withheld | n/a | 7% |
| Calgary | 9,603 | -14% | $2.93B | $333K | 91.6% |
| Nashville | 4,287 | -1% | $1.69B | $394K | 100% |
| Chicago | 3,667 | -1% | $4.88B | $1.3M | 100% |
| Seattle | 3,011 | -1% | $1.80B | $604K | 99.1% |
| Hamiltonthis report | 2,337 | -7% | $897M | $405K | 94.7% |
| Vancouver | 2,036 | -9% | $3.11B | $1.6M | 98.2% |
What is behind every number above.
A report is only worth the disclosure attached to it. This is the whole of it.
How the figures are built
- Source
- Hamilton's own published building-permit record, ingested into the Builtie platform and read live from it. No third-party estimate is mixed in.
- Period
- Permits issued between January 1, 2026 and June 30, 2026. Applications and cancellations are excluded.
- Declared value
- The construction cost stated by the applicant on the permit. It is not a contract value, and it excludes land and soft costs. 2,213 of 2,337 permits (94.7%) state one; the rest contribute to the count and not to the value.
- The value screen
- Two classes of bad value are removed before any total: any single permit at or above
$1,000,000,000, and any value at or above$10,000,000that repeats on five or more permits in the same city — a parent project total stamped onto its sub-permits, which would otherwise be counted once per sub-permit. No permit in this market tripped either rule. A percentile trim was tested and rejected: it cannot tell a corrupt value from a genuine large tower. - Rounding
- Values are rounded to the nearest million before display; shares are rounded to the nearest whole per cent, so columns may not sum to exactly 100.
What this page does not tell you
- No approval timeline
- This feed sets the application date equal to the issue date on every row, so we cannot say how long Hamilton takes to approve a permit. The field is 100% populated, which is exactly why it is easy to mistake for real: it is a placeholder, and a "same-day approval" chart drawn from it would be a fabrication. The GTA report carries this section because Toronto publishes a genuine application date.
- No applicant leaderboard
- The applicant field is populated on 0% of Hamilton permits — too few to rank anyone honestly.