Where Los Angeles Construction Is in 2026: Community Plan Areas Ranked
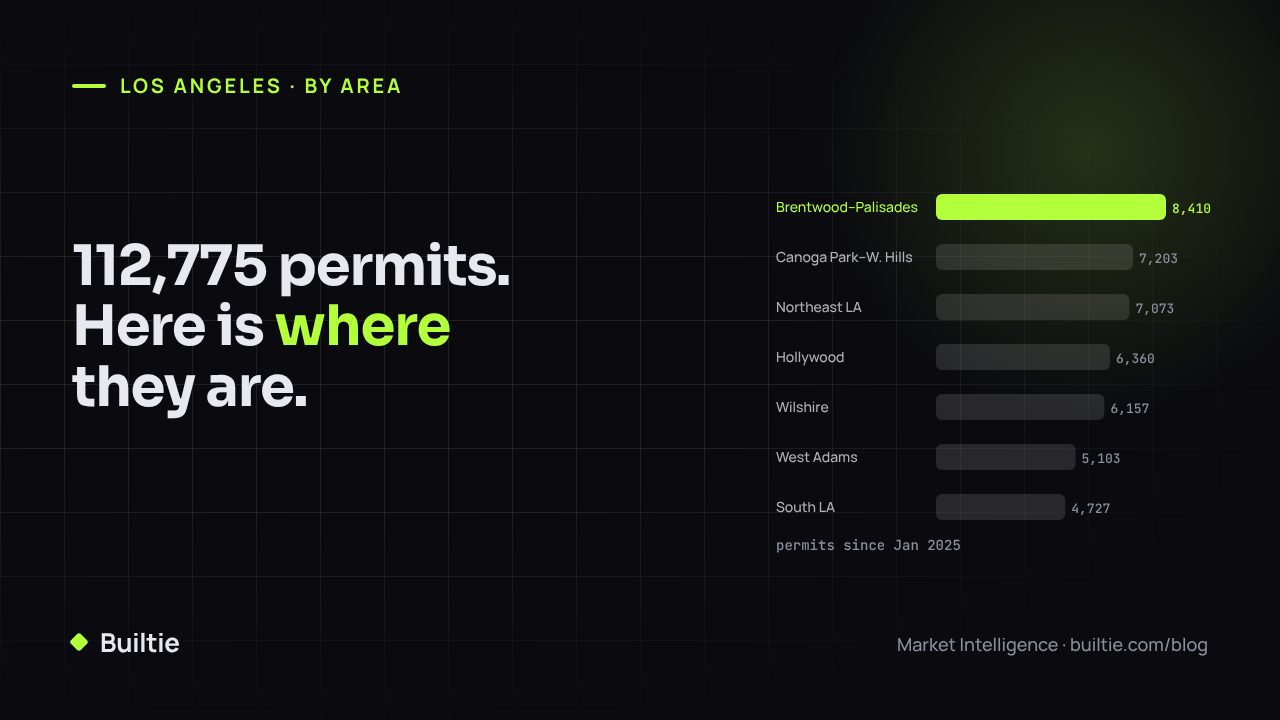
112,775 City of Los Angeles building permits since January 2025, ranked by community plan area, with what each area means for a trade.
The City of Los Angeles issued 112,775 building permits between January 1, 2025 and October 3, 2026, with $13.42 billion of declared value. 55,294 are still active. The market is flat year on year: 32,031 permits in the first half of 2026 against 31,914 in the first half of 2025. Volume is steady; what changes is where it is and what kind of work it is.
The city groups its neighborhoods into community plan areas. Here is where the permits are.
The ranking
| Community plan area | Permits | Active | New buildings | Units added | Declared value |
|---|---|---|---|---|---|
| Brentwood–Pacific Palisades | 8,410 | 6,461 | 1,720 | 1,516 | $1.39B |
| Canoga Park–West Hills–Winnetka–Woodland Hills | 7,203 | 3,133 | 388 | 1,701 | $560M |
| Northeast Los Angeles | 7,073 | 3,209 | 421 | 355 | $296M |
| Hollywood | 6,360 | 3,330 | 264 | 1,770 | $696M |
| Wilshire | 6,157 | 2,994 | 211 | 3,594 | $931M |
| West Adams–Baldwin Hills–Leimert | 5,103 | 2,266 | 301 | 2,176 | $387M |
| South Los Angeles | 4,727 | 2,218 | 382 | 1,149 | $353M |
| Sherman Oaks–Studio City–Toluca Lake–Cahuenga Pass | 4,343 | 2,126 | 188 | 533 | $235M |
| Van Nuys–North Sherman Oaks | 4,175 | 1,952 | 342 | 753 | $268M |
| West Los Angeles | 4,164 | 2,055 | 148 | 1,493 | $675M |
| Encino–Tarzana | 4,043 | 2,141 | 265 | 478 | $310M |
| North Hollywood–Valley Village | 4,010 | 1,757 | 319 | 1,143 | $299M |
| Palms–Mar Vista–Del Rey | 3,836 | 1,673 | 181 | 1,191 | $332M |
| Reseda–West Van Nuys | 3,551 | 1,419 | 275 | 793 | $212M |
| Chatsworth–Porter Ranch | 3,543 | 1,428 | 227 | 579 | $241M |
Two areas with few permits carry a lot of value: the Los Angeles International Airport area ($2.79B on 432 permits, 399 of them commercial) and Central City, downtown ($749M on 291 permits, 714 units).
What each area means for a trade
Brentwood–Pacific Palisades is the wildfire rebuild. It has the most new buildings in the city (1,720) and three in four of its permits are still active. Single-family envelope and finish trades: roofing, windows and doors, cabinets, flooring, pools. See the rebuild playbook.
Canoga Park–West Hills–Winnetka–Woodland Hills is West Valley volume: the second-highest permit count, 1,701 units added and the city's largest number of ADU permits. Repeatable residential work for ADU, roofing, window and kitchen trades.
Northeast Los Angeles has the third-highest permit count but only $296M of value and 355 units. These are small jobs on existing homes: repairs, remodels and re-roofs. High volume, low ticket, many owner-run projects.
Hollywood mixes residential and commercial: 1,770 units added and 831 commercial permits. Multifamily trades and tenant-improvement trades both have work.
Wilshire adds more housing units than any other area (3,594) on just 211 new buildings, which means apartment buildings. It also holds six permits declared over $25M. This is where multifamily drywall, framing, fire sprinkler and finish trades should look first.
West Adams–Baldwin Hills–Leimert and South Los Angeles add 2,176 and 1,149 units on 301 and 382 new buildings: small apartment buildings, duplexes and ADUs. South Los Angeles has 973 ADU permits.
West Los Angeles has $675M of value and 869 commercial permits on 4,164 permits: higher-ticket commercial and multifamily work.
Reading the table
- Permits measure how many buyers there are. Value measures how much each one spends. Northeast LA and Wilshire have similar permit counts and a threefold difference in value.
- Active permits measure what is still open. Brentwood–Pacific Palisades still has 6,461 open; Canoga Park and Northeast LA have similar active counts, but Canoga Park is adding nearly five times as many units.
- New buildings and units measure where whole packages are bought. An alteration buys one or two trades; a new building buys all of them.
How Builtie fits
Builtie tracks every City of Los Angeles building permit, names the builder or the architect and engineer behind it, and runs LinkedIn and email outreach to the people who award the work in the areas you choose. The Los Angeles construction report has the full area list and a trade-by-trade breakdown. Los Angeles coverage is the City of Los Angeles only, not neighboring cities such as Santa Monica, Pasadena, Glendale, Burbank or Long Beach; Builtie covers North America, with the Greater Toronto Area as its founding and deepest market. Starter is $79 per seat per month for up to 20 projects with a 7-day free trial; Growth is $99 for 50 projects and includes LinkedIn and email outreach.
Know the projects. Reach the decision makers. Pick your Los Angeles areas at builtie.com.
Frequently asked questions
Which part of Los Angeles has the most construction?
By permit count, Brentwood–Pacific Palisades (8,410 permits since January 2025, 6,461 still active), driven by the wildfire rebuild. By housing units added, Wilshire (3,594). By declared value, the Los Angeles International Airport area ($2.79B on 432 permits).
Is Los Angeles construction growing?
It is flat. The City of Los Angeles issued 32,031 building permits in the first half of 2026 ($4.11B declared) against 31,914 in the first half of 2025.
Does this include Santa Monica, Pasadena or Long Beach?
No. These are City of Los Angeles (LADBS) permits only. Santa Monica, Pasadena, Glendale, Burbank, Long Beach and other cities in Los Angeles County issue their own permits.
Builtie Team
Intelligence and outreach for North American construction trades.