Residential
- Permits
- 2,620
- Active
- 855
- Value
- $18.3M
2,415 on single-family and duplex homes, 205 on apartment buildings.
Builtie report · live data
Building demolitions, usually the first step before a new home, an ADU or a multifamily build. 3,040 demolition permits issued by the City of Los Angeles since January 2025; 1,034 are still active, worth $14.5M. Updated from LADBS every day.
Live from City of Los Angeles Department of Building and Safety (LADBS), issued building permits, data.lacity.org. Last refresh Oct 8, 2026, 10:33 AM Pacific; newest permit issued 2026-10-02. Value is the declared valuation on each permit.
Live map
Each square is about one square kilometre, shaded by how many permits it has issued since January 2025. Switch the layer to see only active jobs, residential or commercial work, or construction value. Dots are the largest active projects; tap one for its type, value and area.
Residential vs commercial
Homes drive the volume: single-family remodels, additions, ADUs and new houses. Commercial permits are fewer and far larger: offices, retail, restaurants, warehouses, studios and LAX.
2,415 on single-family and duplex homes, 205 on apartment buildings.
Average $44.7K per permit, against $7.0K for residential.
Grading, retaining and site permits not tied to a building type, plus signs.
What kind of building each permit is for.
New construction, additions, remodels, demolitions and site work.
Usage
The 12 most common uses on Los Angeles permits since January 2025, as LADBS records them, with how many are still active and the value declared.
About 145 a month, every month. Hover a month for its numbers.
Median permit: $5.0K. The 1 permits over $1M hold 7% of the value.
Neighbourhoods
Permits, active jobs, new buildings, housing units and value for every planning area the city reports. Sort by any column.
| Area | Residential / commercial | |||||
|---|---|---|---|---|---|---|
| 254 | 71 | 0 | 0 | $2.9M | ||
| 236 | 86 | 0 | 0 | $1.9M | ||
| 197 | 74 | 0 | 0 | $1.5M | ||
| 187 | 53 | 0 | 0 | $1.2M | ||
| 182 | 64 | 0 | 0 | $2.6M | ||
| 175 | 57 | 0 | 0 | $1.2M | ||
| 170 | 42 | 0 | 0 | $1.4M | ||
| 158 | 37 | 0 | 0 | $1.3M | ||
| 158 | 53 | 0 | 0 | $1.1M | ||
| 144 | 57 | 0 | 0 | $1.7M | ||
| 133 | 40 | 0 | 0 | $1.1M | ||
| 108 | 41 | 0 | 0 | $1.3M | ||
| 90 | 25 | 0 | 0 | $795K | ||
| 80 | 27 | 0 | 0 | $795K | ||
| 77 | 33 | 0 | 0 | $578K |
This week
Fresh from LADBS. Sign in to see the address, the contractor, architect and engineer on the permit, and the decision makers at the builder.
By trade
The same live numbers, map and neighbourhood table for the permits that matter to one trade.
Every issued building permit in the city.
Read the reportRe-roofs and new roofs on Los Angeles homes and buildings, from Class A re-roofs in the Valley to new roof structures on rebuilds.
Read the reportBackyard units, garage conversions and attached ADUs: the fastest-growing kind of housing permit in the city.
Read the reportRemodels that move kitchens and bathrooms: cabinetry, countertops, tile, fixtures and the finish trades that follow.
Read the reportNew, enlarged and replaced windows, doors and sliders, on remodels, additions and rebuilds.
Read the reportEvery new single-family home and duplex the city has permitted, including the wildfire rebuilds in the Palisades.
Read the reportNew apartment buildings and additions, from four-unit infill to 100% affordable mid-rises.
Read the reportOffices, retail, restaurants, warehouses, studios and tenant improvements across the city.
Read the reportJobs that call for fire sprinklers or alarms, including the NFPA 13D systems required in new homes and rebuilds.
Read the reportSoft-story and seismic retrofits, foundation repairs and replacements.
Read the reportRebuilds and repairs after the January 2025 fires, concentrated in Pacific Palisades and Brentwood.
Read the reportNew and remodeled private pools and spas, mostly on single-family lots.
Read the reportExterior stucco and siding, drywall and insulation work on remodels, additions and repairs.
Read the reportOn the ground
For trades
Tell Builtie what you install and which parts of LA you work. The feed shows only the issued, still-active permits that need your trade.
Every project carries the contractor, architect and engineer from the permit, the builder's licence, phone and website, and its decision makers.
Reach out by LinkedIn, email or phone while the job is still at the stage where trades are chosen, and track every reply in one place.
LADBS does not tag permits by trade, so this report counts LADBS building-demolition permits. A permit can appear in more than one trade report.
Every number on this page is an issued permit. Builtie loads the City of Los Angeles Department of Building and Safety (LADBS) dataset of issued building permits, so every row already has an issue date. Applications that are still in plan check are not counted.
An active permit has been issued and has not been finaled, closed, expired or given a certificate of occupancy. Those are the jobs still being built, which is where a trade can still sell. Finished jobs are hidden from the Builtie feed but still counted in the totals above.
The database re-reads LADBS every day and this page re-computes its numbers every hour. The time of the last refresh is shown under the headline figures.
The City of Los Angeles, which LADBS permits: the San Fernando Valley, the Westside, Hollywood, downtown, South and East Los Angeles, the Harbor area and LAX. Separate cities inside LA County (Santa Monica, Beverly Hills, Pasadena, Long Beach, Glendale, Burbank and others) issue their own permits and are not included yet.
The project feed filtered to your trade, each permit's contractor, architect and engineer as LADBS lists them, the builder's company profile with phone, website and licence, and the decision makers at that company, ready for outreach. The free trial includes Los Angeles.
Start a free trial with Los Angeles already selected, or book fifteen minutes and we will pull live LA projects for your trade on the call.
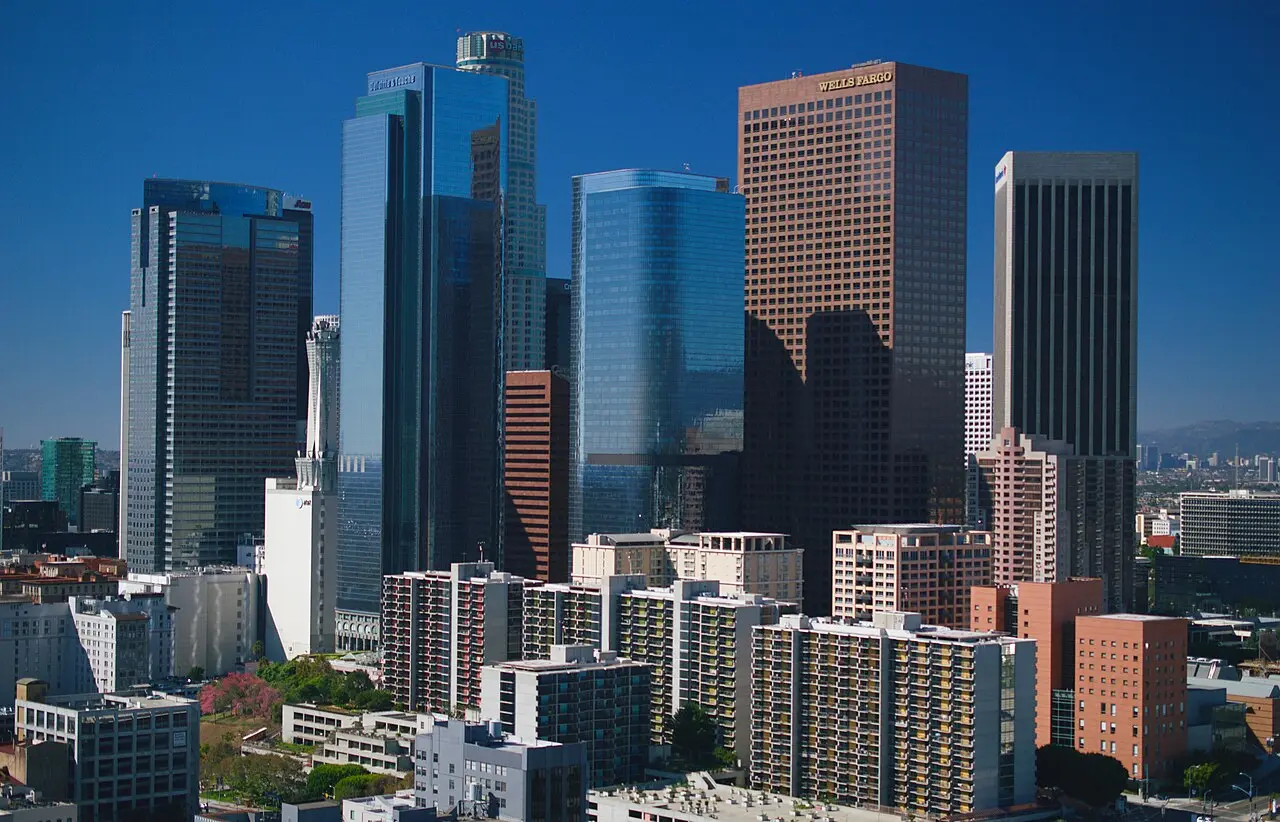
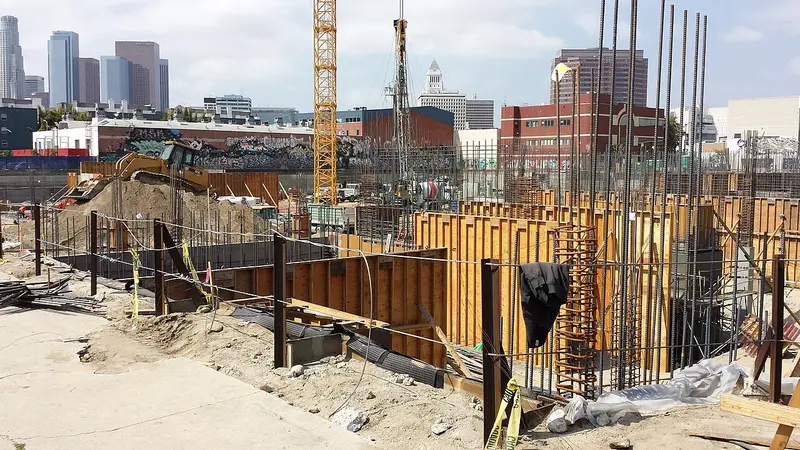
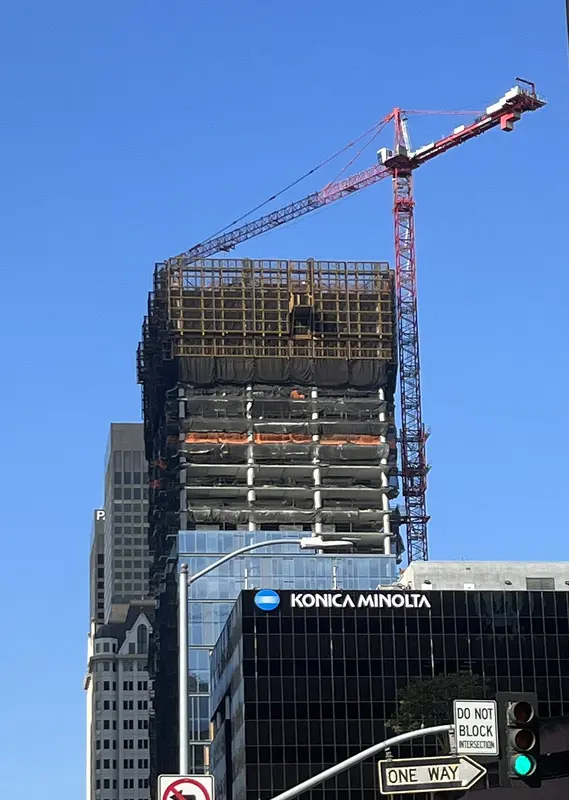
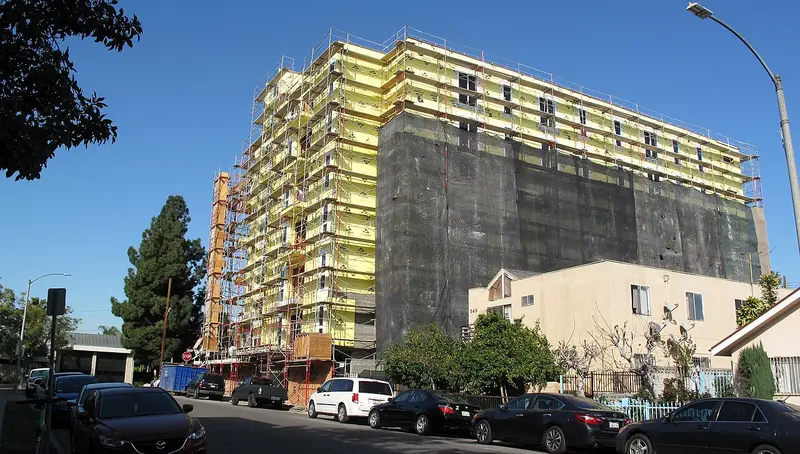
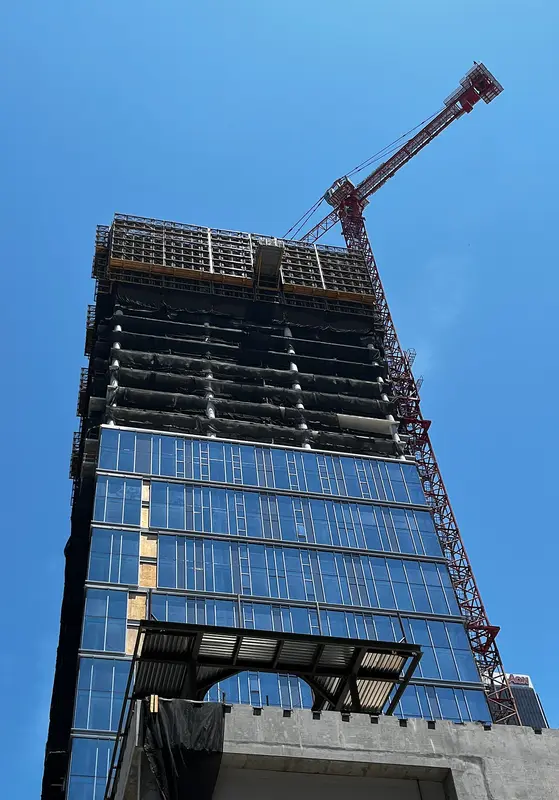
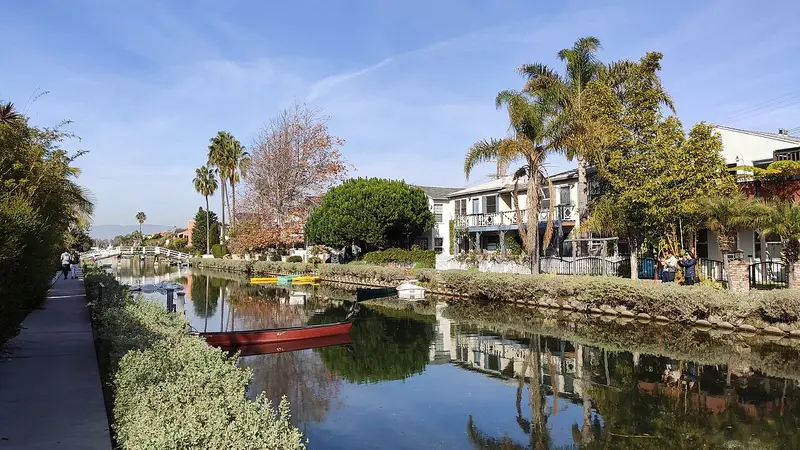
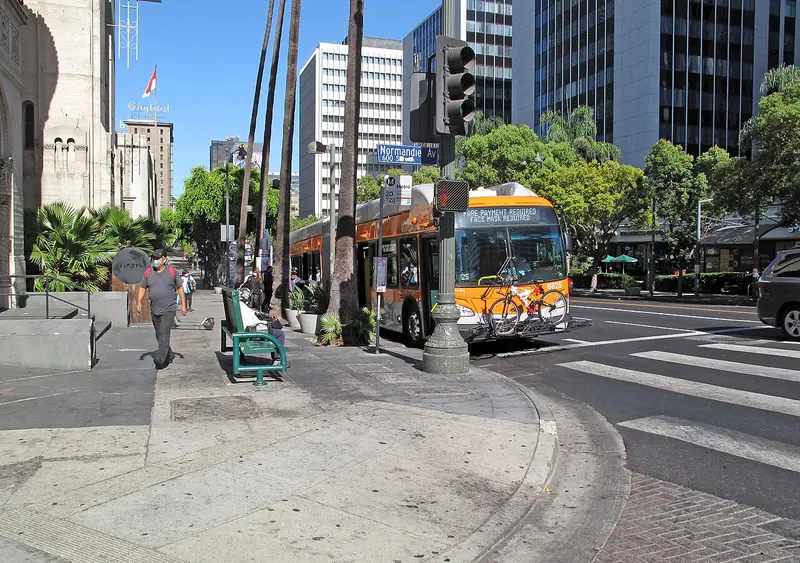
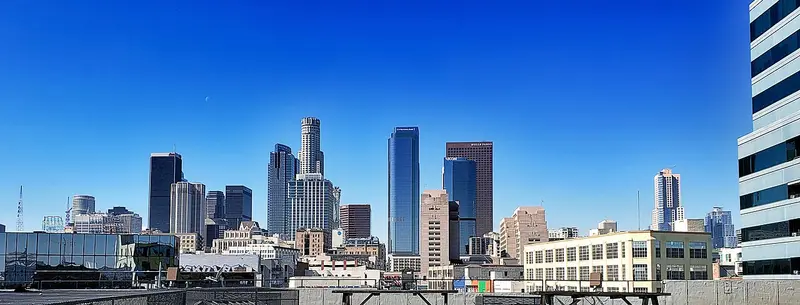
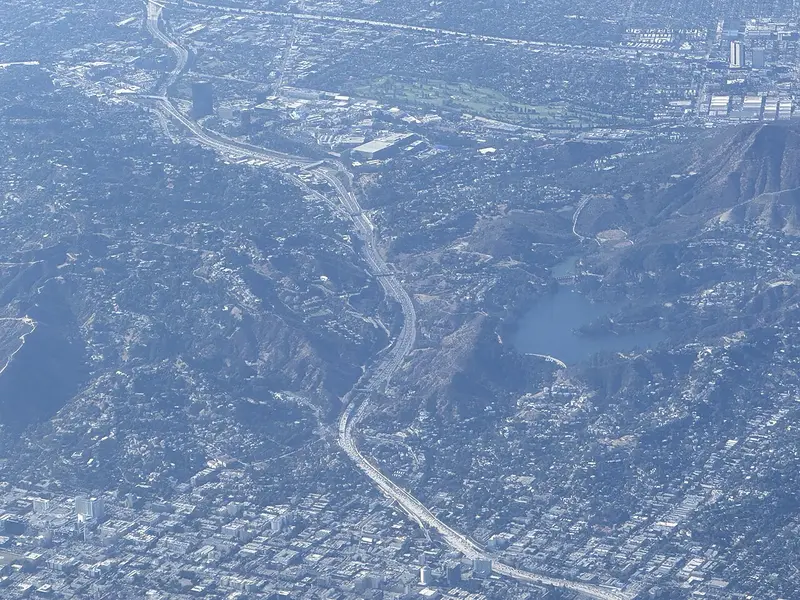
Photos from Wikimedia Commons: Skyline (top) by Levi Clancy, CC BY-SA 4.0; Arts District by Patrick Pelletier, CC BY-SA 3.0; 8th and Figueroa, downtown by Benoît Prieur, CC0; Melrose at Oxford by Downtowngal, CC BY-SA 4.0; Downtown tower, 2022 by Benoît Prieur, CC0; Venice by Américo Toledano, CC BY-SA 4.0; Wilshire at Normandie by Downtowngal, CC BY-SA 4.0; Downtown from the Toy District by Eric Polk, CC BY-SA 4.0; Hollywood Freeway from the air by Maplemoths, CC BY 4.0. Map tiles © OpenStreetMap contributors, © CARTO.