
Vancouver Construction Permit Index, September 2026: 88.9
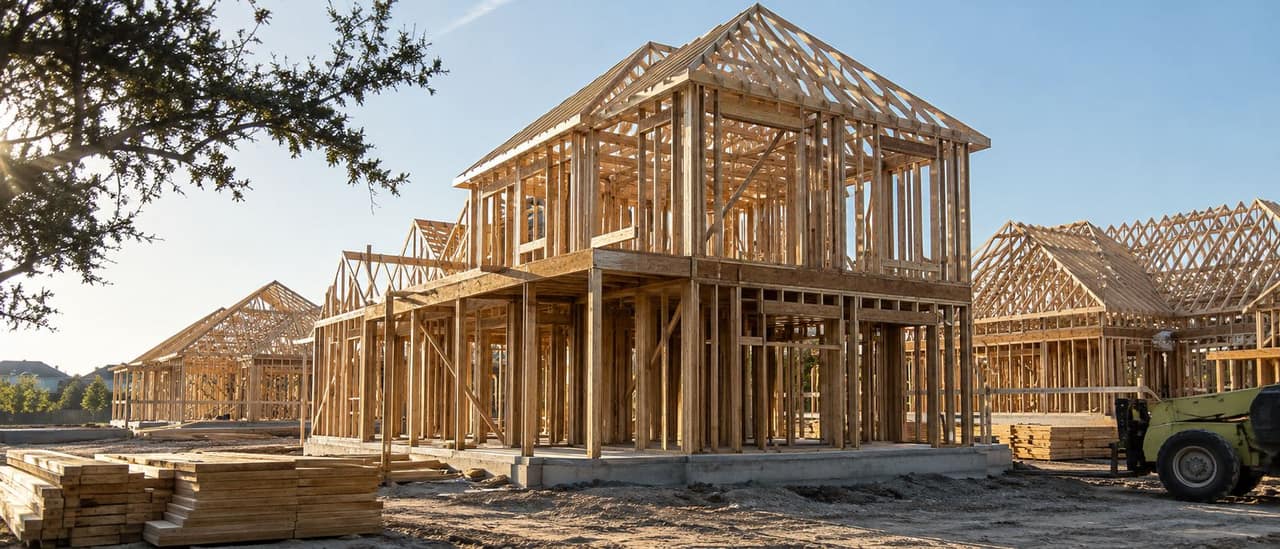
The City of Vancouver issued 333 construction permits in September 2026, which puts the Builtie Construction Permit Index for Vancouver at 88.9 (its average month, January to September 2025 = 100), down 0.6% on September 2025 and up 10.6% on August 2026.
The same four steps, whether the buyer is a builder, a designer, an owner or a company you want to acquire.
September 2026 at a glance
| Measure | September 2026 |
|---|---|
| Index (base = 100) | 88.9 |
| Permits issued | 333 |
| Change on August 2026 | +10.6% |
| Change on September 2025 | -0.6% |
| Base: average month | 375 |
| Three-month average | 87.6 |
| Three-month average, change on a year earlier | -12.7% |
The three months to September 2026 averaged 87.6, down 12.7% on the same three months a year earlier.
Average month, January to September 2025 = 100. Gaps are months below the publish rule. Permits read October 9, 2026.
Month by month
| Month | Permits issued | Index | Month over month | Year over year | Note |
|---|---|---|---|---|---|
| September 2026 | 333 | 88.9 | +10.6% | -0.6% | |
| August 2026 | 301 | 80.4 | -14.0% | -15.4% | |
| July 2026 | 350 | 93.4 | +9.0% | -19.7% | |
| June 2026 | 321 | 85.7 | -7.2% | -14.6% | |
| May 2026 | 346 | 92.4 | +15.3% | -19.3% | |
| April 2026 | 300 | 80.1 | -21.1% | -15.0% | |
| March 2026 | 380 | 101.5 | +23.0% | +0.8% | |
| February 2026 | 309 | 82.5 | -19.1% | -3.4% | |
| January 2026 | 382 | 102.0 | +4.9% | -1.8% | |
| December 2025 | 364 | 97.2 | +5.8% | n/a | |
| November 2025 | 344 | 91.8 | -20.7% | n/a | |
| October 2025 | 434 | 115.9 | +29.6% | n/a | |
| September 2025 | 335 | 89.4 | -5.9% | n/a | |
| August 2025 | 356 | 95.0 | -18.3% | n/a | |
| July 2025 | 436 | 116.4 | +16.0% | n/a | |
| June 2025 | 376 | 100.4 | -12.4% | n/a | |
| May 2025 | 429 | 114.5 | +21.5% | n/a | |
| April 2025 | 353 | 94.2 | -6.4% | n/a | |
| March 2025 | 377 | 100.7 | +17.8% | n/a | |
| February 2025 | 320 | 85.4 | -17.7% | n/a | |
| January 2025 | 389 | 103.9 | n/a | n/a |
The base is Vancouver's average month over January to September 2025, the months on record in the base year: 375 permits.
What was permitted
Permits Builtie could classify by building type and work, for September 2026 and for the twelve months to it. Permits with no building type, demolitions and unclassified work are counted in the index but not here.
| Building type and work | Permits, September 2026 | Share, September 2026 | Share, Oct 2025 to Sep 2026 |
|---|---|---|---|
| Commercial Renovation | 109 | 38% | 34% |
| Residential Renovation | 100 | 35% | 30% |
| New Residential Construction | 59 | 20% | 26% |
| Institutional Renovation | 13 | 4% | 3% |
| New Commercial Construction | 1 | 0% | 3% |
| Industrial Renovation | 5 | 2% | 3% |
| New Institutional Construction | 1 | 0% | 1% |
| New Industrial Construction | 1 | 0% | 0% |
How Vancouver compares
Vancouver is one of the 15 markets in the composite Builtie Construction Permit Index. Among the 17 markets indexed for September 2026, Vancouver ranks 10 of 17 on year-over-year change.
What the Vancouver data covers
The data is the City of Vancouver. Burnaby, Richmond, Surrey and the rest of Metro Vancouver issue their own permits and are not in the feed today.
More on Vancouver: Vancouver construction permits by month; the September 2026 permit report; Vancouver construction leads by trade.
How to cite
Builtie Construction Permit Index, Vancouver, September 2026, builtie.com/vancouver-construction-permit-index/.
Plans
Builtie's Starter plan is $79 per seat per month (CAD) for 20 projects; Growth is $99 for 50 projects and adds LinkedIn and email outreach. Opening a project spends one credit, and the decision makers inside it are included. The free trial runs 7 days with 10 projects. Plans and the Custom plan, where Builtie's team runs the outreach, are on the pricing page.
Frequently asked questions
What is the Vancouver construction permit index for September 2026?
88.9 (average month, January to September 2025 = 100), from 333 permits issued. Released October 15, 2026 by Builtie.
Is construction in Vancouver up or down?
By permits issued, September 2026 was down 0.6% on September 2025 and up 10.6% on August 2026. The three months to September 2026 averaged 87.6, down 12.7% on the same three months a year earlier.
How is the index calculated?
Permits issued in the month, divided by Vancouver's average month over January to September 2025, the months on record in the base year, times 100. A month counts only with 40 or more permits and at least half the market's median month.
Where does the data come from?
The City of Vancouver's own building permits, read by Builtie October 9, 2026.
What does Builtie cost?
Starter is $79 per seat per month (CAD) for 20 projects; Growth is $99 for 50 projects and adds LinkedIn and email outreach. There is a 7-day free trial with 10 projects.